Superhetrodyne Filtering [eng]
Sometimes you run into something you know you learned first or second year of university and then you just can’t remember how it works when you see it 10 years later. This was me when it came back to mixing down an RF signal to an IF frequency and the filtering that is need for this to work properly. A block diagram of a superheterodyne receiver is provided in Figure 1 (source).
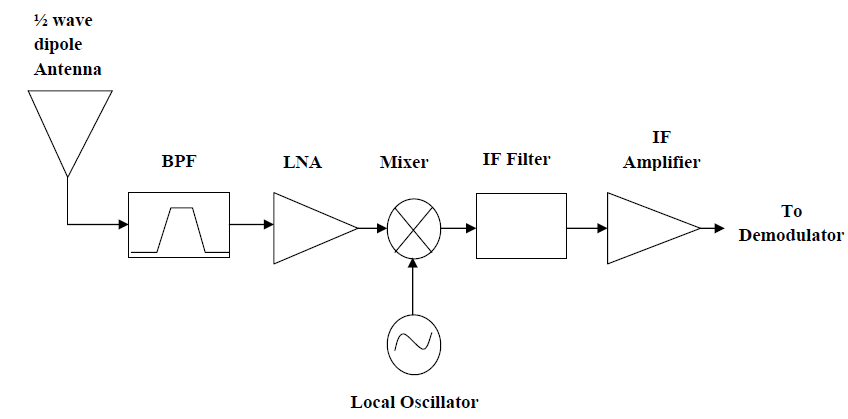 Figure 1 - Block Diagram of superheterodyne receiver
What confused me was that I knew that the IF-filter is needed to avoid aliasing in ADC but at that point we are already at baseband (in my world), so just how necessary is the bandpass filter? I know that it is for selectivity, noise reduction and to avoid overloading the mixer but can you strictly go without it? As you do I went to ChatGPT to have a discussion as well as pouring over Wikipedia. I then cobbled together some Python code that is available in an appendix to this post and my conclusion was this. You can get away with not using a BPF filter if your IF filter is a bandpass and not a lowpass filter. Why you ask? Because a lowpass filter will not remove the negative frequency components that are created as a result of the mixer but a bandpass will.
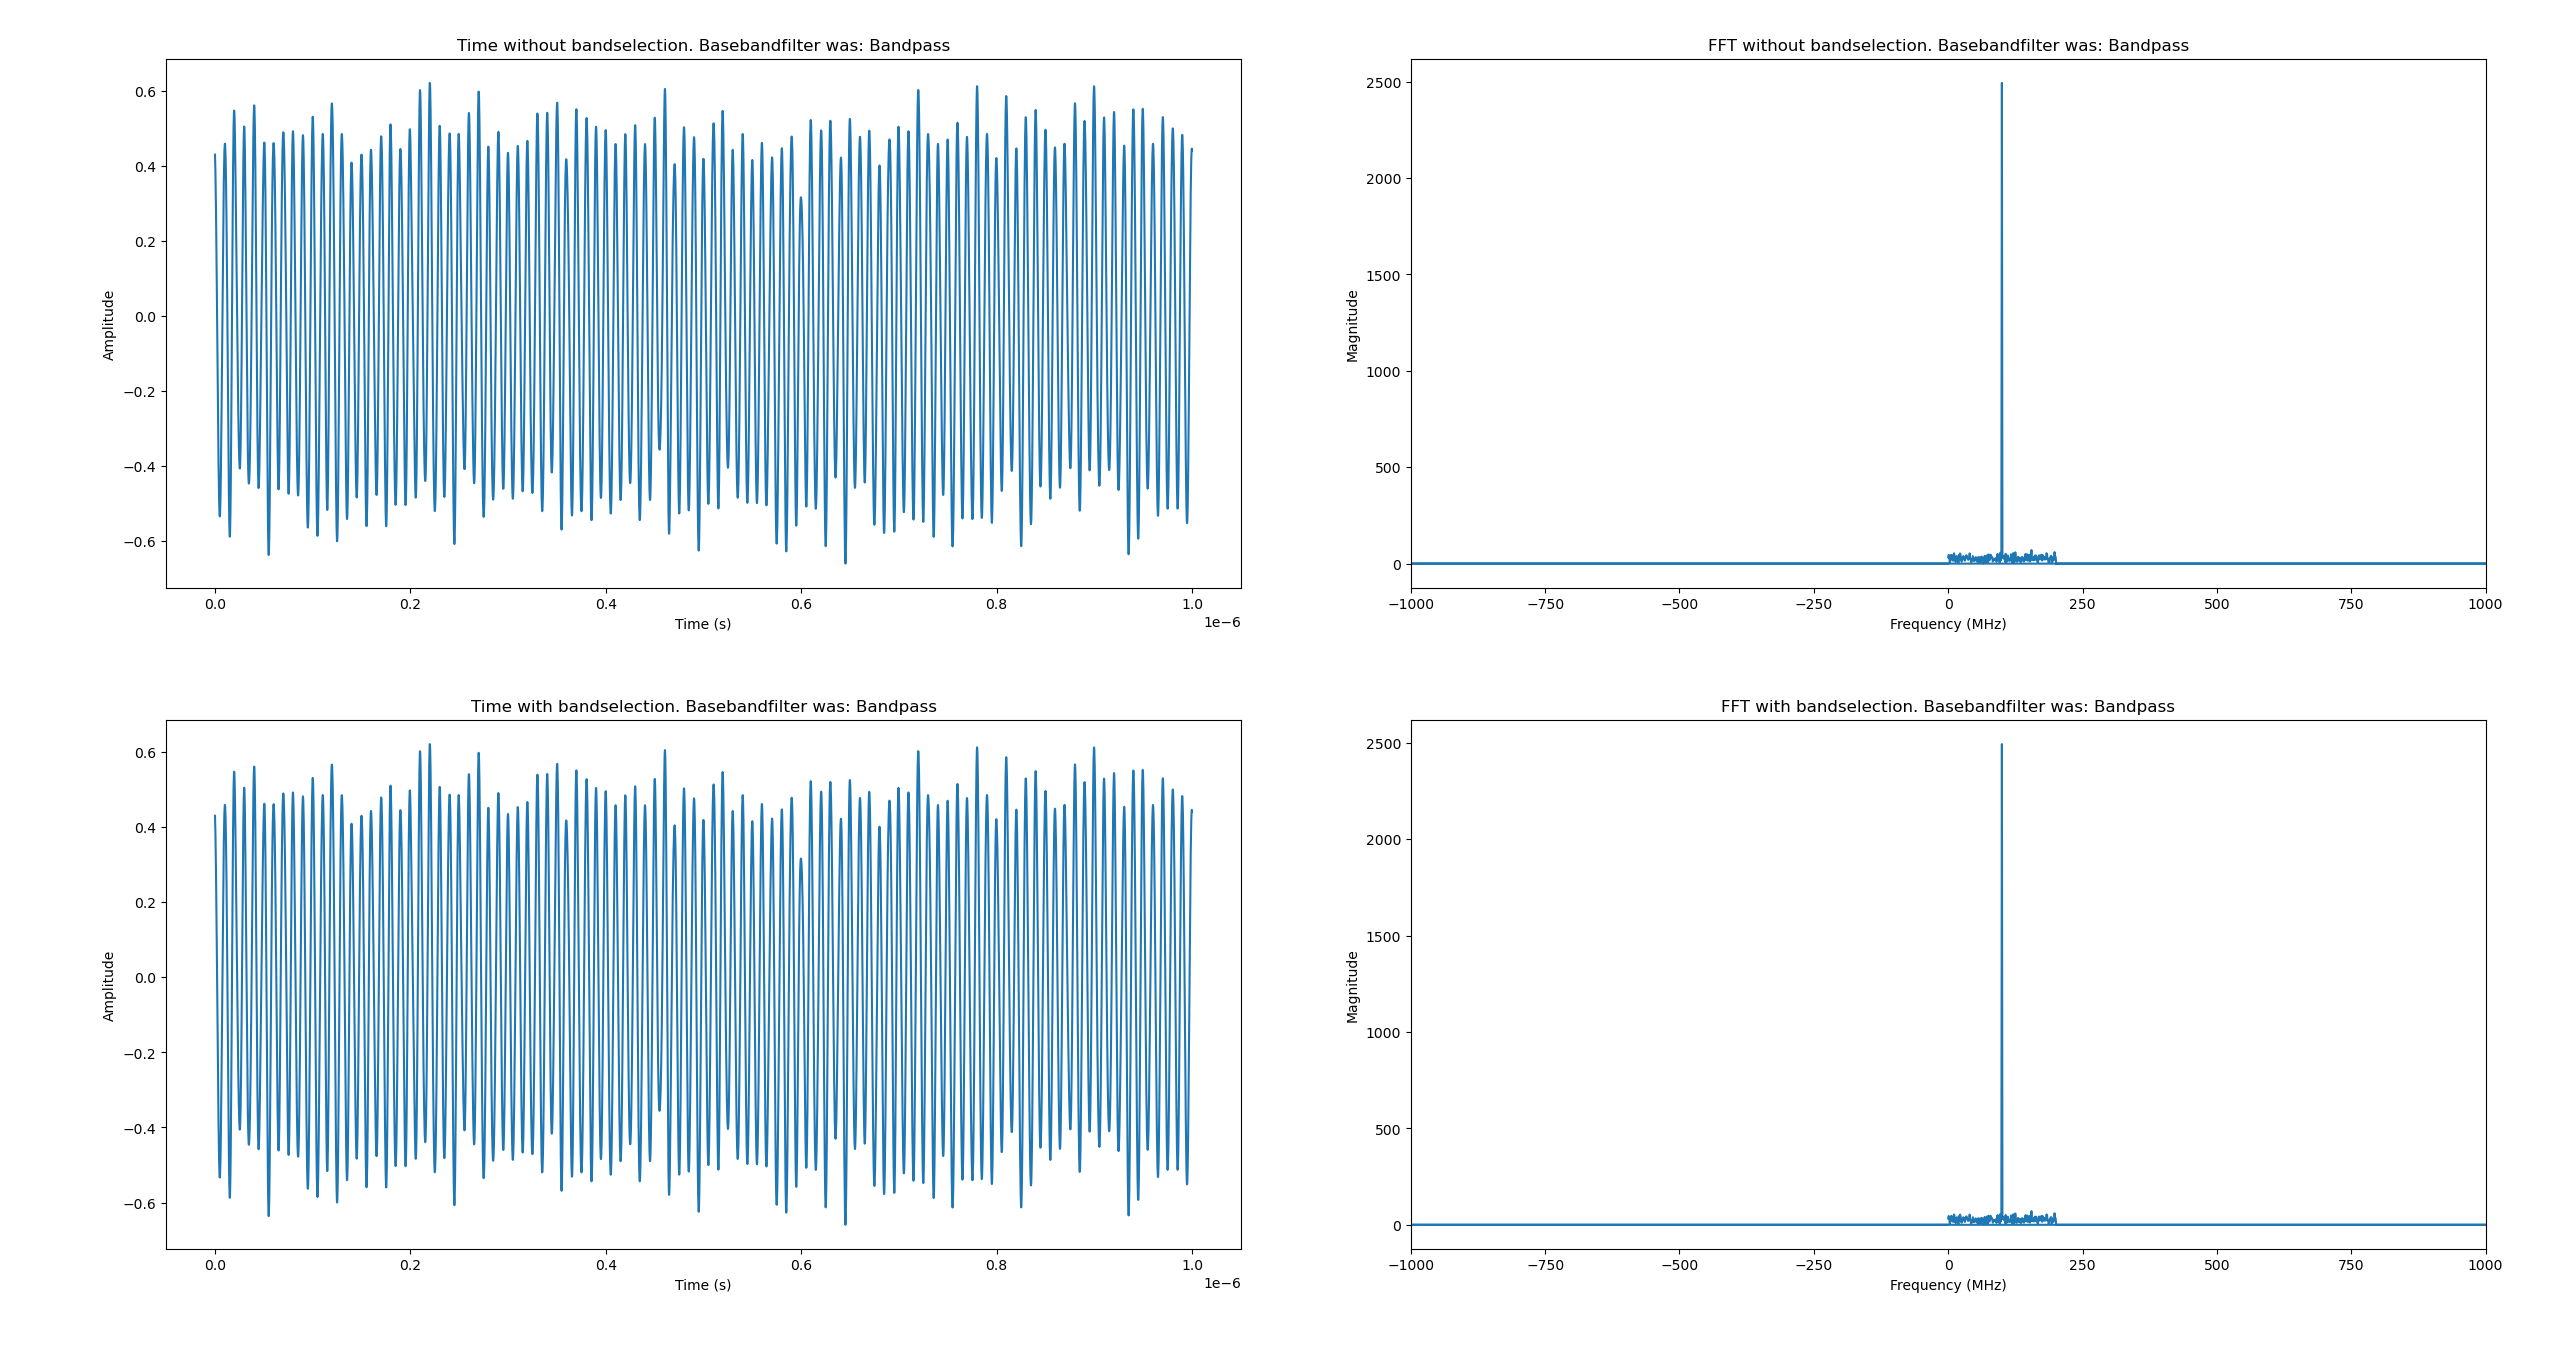 Figure 2 - Bandpass result
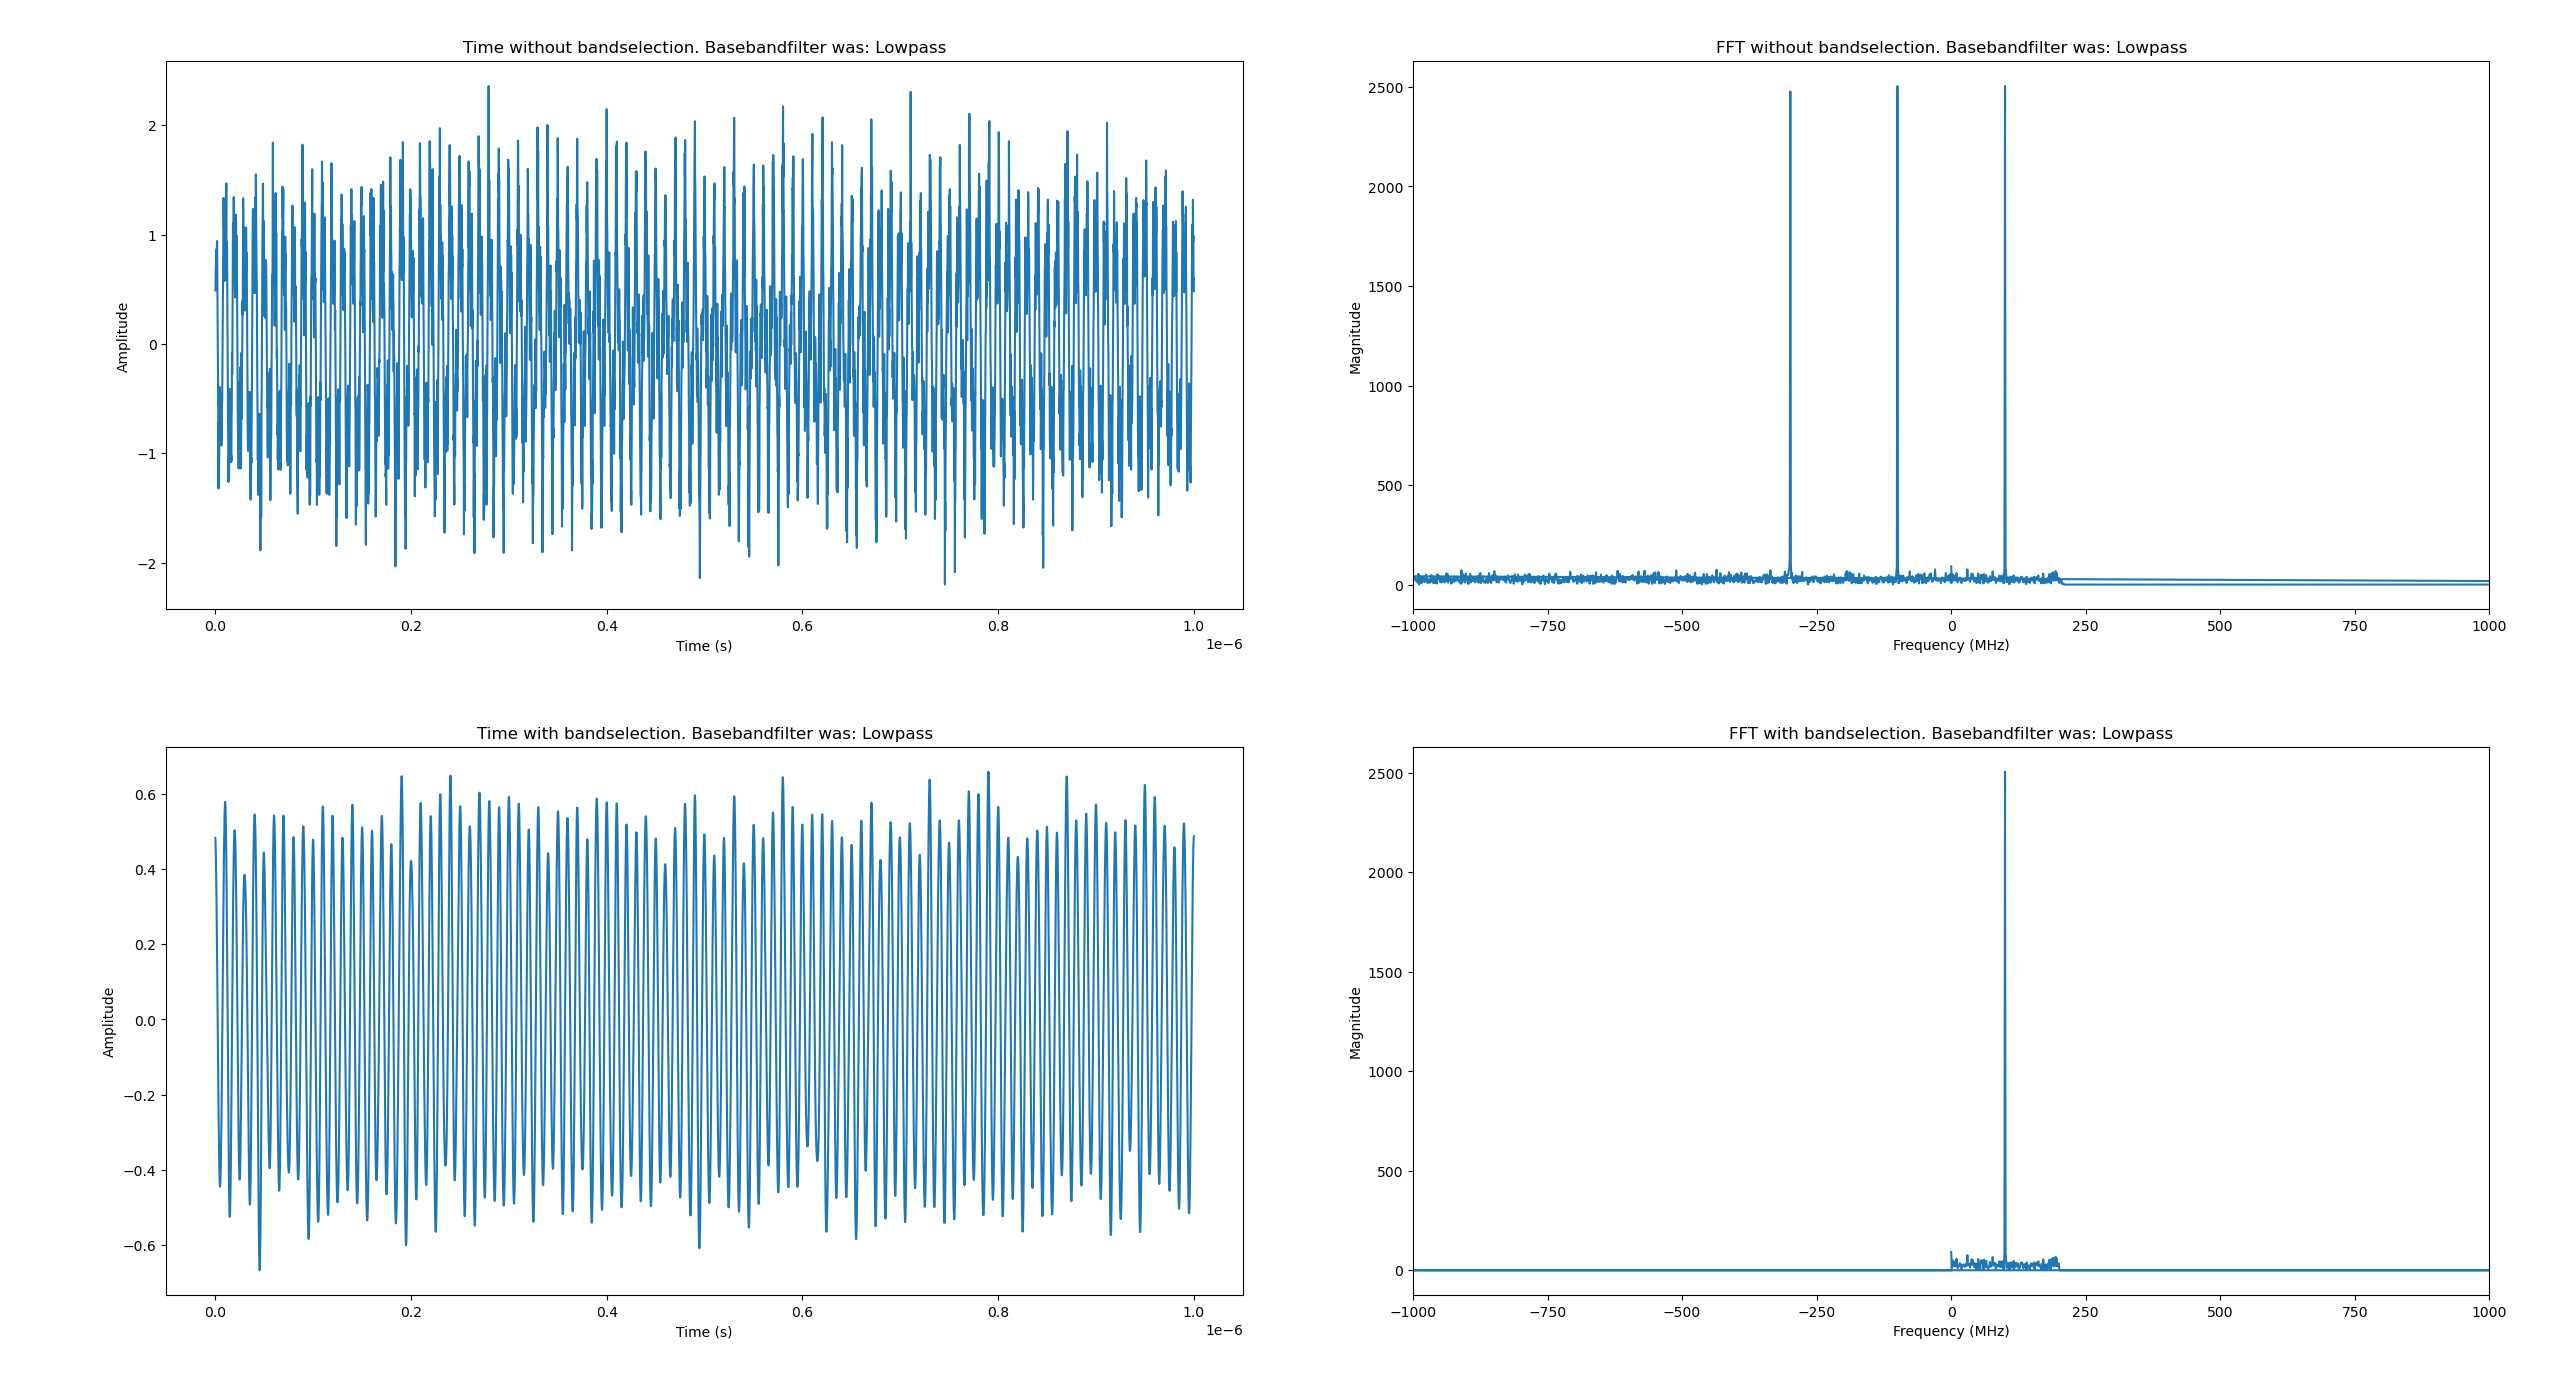 Figure 2 - Lowpass result
Conclusion
So for now I at least think I managed to learn this again on some base level. And strictly speaking I would always use a BPF filter if possible for simpler “throw stuff together” I might go without it. As always I might return to this at some point, when I realize that I’m wrong yet again :)
Appendix - Python Code
import numpy as np
import matplotlib.pyplot as plt

# Constants
f_RF = 2400e6  # Desired RF signal
f_LO = 2300e6  # Required local oscillator
f_IF = f_RF-f_LO # Upper side injection
f_image = f_LO + f_IF # Image frequency

# Generate time samples
t = np.linspace(0, 1e-6, 5000)  # 1 microsecond of data

# Use noise to show filtering
noise = np.random.normal(0,1,len(t))*0.3

# Generate desired RF and image signals
RF_signal = np.sin(2 * np.pi * f_RF * t) + noise
image_signal = np.sin(2 * np.pi * f_image * t) + noise

# Mixing signals with the local oscillator
mixed_RF = RF_signal * np.sin(2 * np.pi * f_LO * t)
mixed_image = image_signal * np.sin(2 * np.pi * f_LO * t)

# Filter function (simple representation of bandpass filter around f_RF)
def bandpass_filter(signal, center_freq, bandwidth):
    freqs = np.fft.fftfreq(len(signal), d=(t[1] - t[0]))
    spectrum = np.fft.fft(signal)
    mask = np.abs(freqs - center_freq) > bandwidth/2
    spectrum[mask] = 0
    return np.fft.ifft(spectrum)

def baseband_bandpass_filter(signal, center_freq, bandwidth):
    freqs = np.fft.fftfreq(len(signal), d=(t[1] - t[0]))
    spectrum = np.fft.fft(signal)
    mask = np.abs(freqs - center_freq) > bandwidth/2
    spectrum[mask] = 0
    return np.fft.ifft(spectrum)

def baseband_lowpass_filter(signal, cutoff_freq, transition_band=10e6):
    freqs = np.fft.fftfreq(len(signal), d=(t[1] - t[0]))
    spectrum = np.fft.fft(signal)

    # Create a mask for the transition band
    lower_bound = cutoff_freq
    upper_bound = cutoff_freq + transition_band
    mask = (freqs > lower_bound) & (freqs < upper_bound)
    # Linear transition from 1 to 0 over the transition band
    spectrum[mask] = spectrum[mask] * (1 - (freqs[mask] - lower_bound) / transition_band)

    # Suppress frequencies beyond the transition band
    spectrum[freqs > upper_bound] = 0
    return np.fft.ifft(spectrum)


bb_filter = ""

# Without filter: both signals are present
without_filter = mixed_RF + mixed_image

# With filter: only desired signal is present
with_filter = bandpass_filter(mixed_RF + mixed_image, f_IF, 200e6)

filter_bw = 200e6
if(True):
    bb_filter = "Bandpass"
    with_filter = baseband_bandpass_filter(with_filter, 100e6, filter_bw)
    without_filter = baseband_bandpass_filter(without_filter, 100e6, filter_bw)
elif(True):
    bb_filter = "Lowpass"
    with_filter = baseband_lowpass_filter(with_filter, filter_bw)
    without_filter = baseband_lowpass_filter(without_filter, filter_bw)
else:
    bb_filter = "None"


# FFT calculations
freqs = np.fft.fftfreq(len(t), d=(t[1]-t[0])) / 1e6
without_filter_spectrum = np.fft.fft(without_filter)
with_filter_spectrum = np.fft.fft(with_filter)

fft_width = 1000

selection = f"bandselection. Basebandfilter was: {bb_filter}"

# Plotting
plt.figure(figsize=(12, 8))
filter = f"without {selection}"
plt.subplot(2, 2, 1)
plt.title(f"Time {filter}")
plt.plot(t, without_filter.real)
plt.xlabel('Time (s)')
plt.ylabel('Amplitude')

plt.subplot(2, 2, 2)
plt.title(f"FFT {filter}")
plt.plot(freqs, np.abs(without_filter_spectrum))
plt.xlabel('Frequency (MHz)')
plt.ylabel('Magnitude')
plt.xlim([-fft_width, fft_width])

filter = f"with {selection}"
plt.subplot(2, 2, 3)
plt.title(f"Time {filter}")
plt.plot(t, with_filter.real)
plt.xlabel('Time (s)')
plt.ylabel('Amplitude')

plt.subplot(2, 2, 4)
plt.title(f"FFT {filter}")
plt.plot(freqs, np.abs(with_filter_spectrum))
plt.xlabel('Frequency (MHz)')
plt.ylabel('Magnitude')
plt.xlim([-fft_width, fft_width])

plt.tight_layout()

plt.show()